
Metrics for Text-to-Video Quality Evaluation
No single metric captures text-to-video quality, so combine distribution scores, CLIP alignment, and temporal consistency metrics with human review.
If I had to boil this down to one point, it’s this: no single metric can judge text-to-video well. I need a stack that checks visual quality, prompt match, and motion over time. If I only use one score, I can miss major problems like static clips, prompt drift, or frame flicker.
Here’s the short version:
- Distribution metrics like FVD judge how close generated videos are to real ones as a set, but they do not check if the prompt was followed.
- Frame metrics like PSNR, SSIM, and LPIPS help me spot blur, noise, and frame defects, but they ignore motion and text match.
- Alignment metrics like CLIPScore, ViCLIP, and VQA-based scoring test whether the video shows the right objects, actions, and relations.
- Temporal checks like optical flow, subject consistency, and flicker scores help me see if motion is smooth or if the video just stays still to look better on paper.
- Benchmarks like VBench, T2VEval, and T2VScore combine many signals, while human review still matters for physics errors, anatomy issues, and common-sense mistakes. For automated visual analysis, tools like GPT-4o vision can assist in identifying these defects.
A few numbers stand out. ETVA reached a Spearman correlation of 58.47 with human judgment, versus 31.0 for VideoScore and 13.8 for CLIPScore. The DEVIL setup reported 90%+ Pearson correlation for dynamics scoring, and it also found a -88.9 Pearson correlation between subject consistency and dynamics, which shows a clear tradeoff between motion and stability.
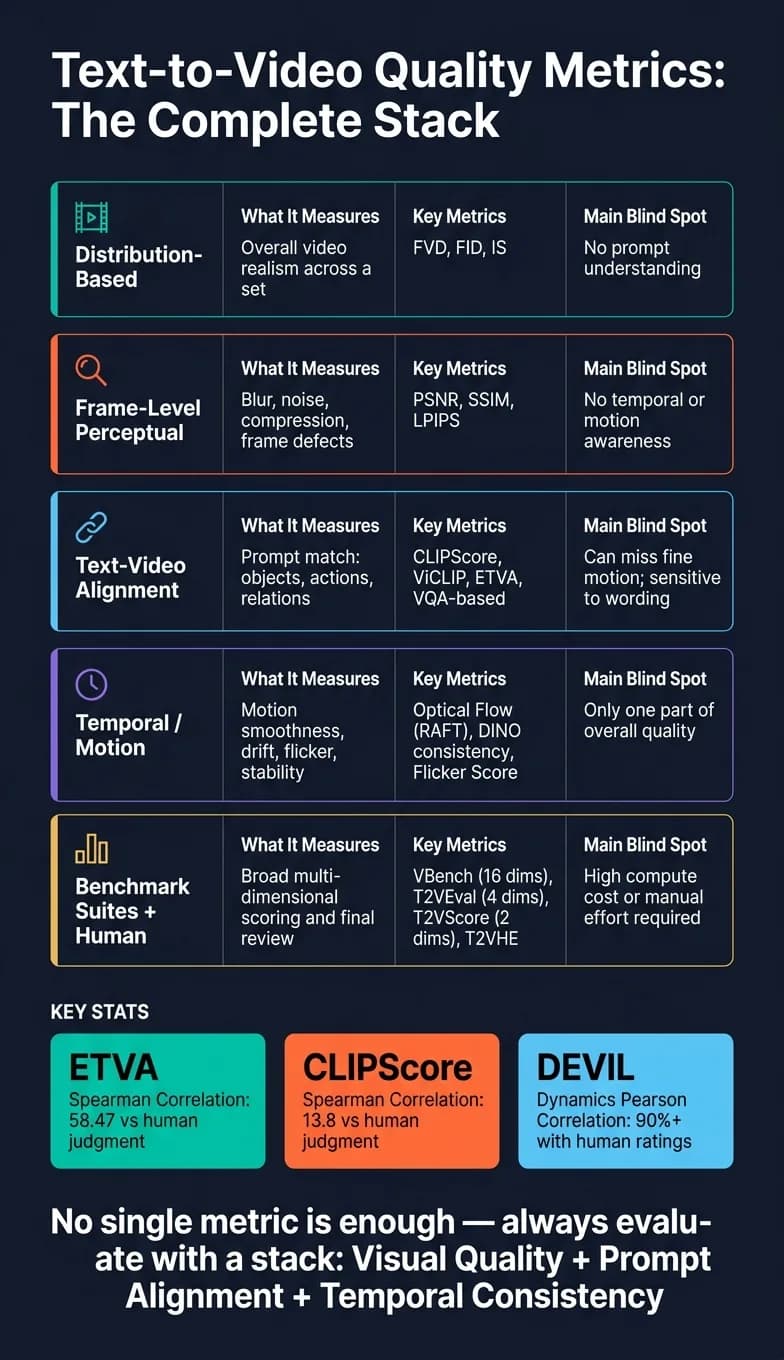
Quick comparison
| Metric group | What I use it for | Main blind spot |
|---|---|---|
| Distribution-based | Overall video realism across a set | No prompt understanding |
| Frame-level perceptual | Blur, noise, compression, frame defects | No time awareness |
| Text-video alignment | Prompt match: objects, actions, relations | Can miss fine motion or be sensitive to wording |
| Temporal/motion checks | Motion smoothness, drift, flicker, stability | Only part of quality |
| Benchmark suites + humans | Broader scoring and final review | More compute or manual work |
So if I’m judging T2V output, I don’t ask just “Does it look good?” I ask three things: Does it look good? Does it follow the prompt? Does it stay consistent over time? These are the benchmarks we use when testing models like Sora 2 for production readiness. That’s the core of the article.
Core Objective Metrics for Generative Video Quality
Objective metrics help measure visual quality and motion consistency, but each one looks at only part of the T2V picture. A good way to read them is in layers: start with distribution-based metrics, then look at frame-level metrics to spot local visual issues.
Fréchet Video Distance and Related Distribution-Based Measures
Fréchet Video Distance (FVD) measures the gap between feature activations of real and generated videos in the feature space of a pre-trained video classifier, most often I3D. In plain English, it checks how close the generated videos are to real videos as a group. Because it works on video features, it can reflect temporal coherence too.
Fréchet Inception Distance (FID) works in a similar way, but on still images with an Inception-v3 network. For video, people usually apply it frame by frame. That makes it a rough visual stand-in, not a motion metric. It has no sense of temporal flow.
Inception Score (IS) looks at both image quality and diversity through class probability distributions from an Inception network. The catch is that it depends on ImageNet classes, which makes it a weak match for video generation.
These metrics are useful for aggregate realism, not prompt alignment. They also come with tradeoffs. FVD needs a large set of reference videos from the same distribution, which makes model comparisons messy when the models were trained on different datasets. And there’s another catch: low-motion outputs from models like Kling V3 can score well, so you still need separate checks for dynamics. This is particularly relevant when evaluating high-fidelity models like Google Veo 3.1.
| Metric | Aspect Captured | Data Requirements | Strengths | Limitations |
|---|---|---|---|---|
| FVD | Spatio-temporal distribution | Large set of reference videos | Captures temporal coherence and motion | High computational cost; requires reference data; prompt-agnostic |
| FID | Frame-level distribution | Large set of reference images | Good for overall visual fidelity | Ignores temporal dynamics and consistency |
| IS | Quality and diversity | Pre-trained Inception network | No reference videos needed | Prone to overfitting; cannot distinguish fine quality differences |
Because these scores ignore prompt semantics, the next step is frame-level perceptual metrics.
SSIM, PSNR, and LPIPS for Frame-Level Perceptual Quality
Where FVD checks the video distribution, SSIM, PSNR, and LPIPS look at single frames. That makes them handy for spotting image defects, even if they can’t say much about motion or text match.
PSNR (Peak Signal-to-Noise Ratio) measures pixel-level differences between a generated frame and a reference frame. It’s very fast, which is nice, but it often does a poor job matching human judgment. A tiny pixel shift can tank the score even when the image still looks good.
SSIM (Structural Similarity Index) improves on that by comparing luminance, contrast, and structure. It tends to be more useful than raw pixel matching, but it still needs a ground-truth reference frame. It also struggles with prompt semantics and motion.
LPIPS (Learned Perceptual Image Patch Similarity) uses deep network features instead of raw pixels. That usually lines up better with human judgment. Even so, it still works frame by frame.
All three share the same core weakness: they evaluate frames in isolation. They have no temporal awareness and no way to judge prompt adherence.
| Metric | Metric Type | Correlation with Human Perception | Suitability for Generative Text-to-Video | Computational Cost |
|---|---|---|---|---|
| SSIM | Structural similarity | Low to moderate | Low (requires ground truth; pixel-level fidelity only) | Low |
| PSNR | Pixel-level fidelity | Low | Low (sensitive to noise and minor shifts) | Very low |
| LPIPS | Deep feature similarity | Moderate to high | Moderate (frame-level perceptual quality only) | Moderate |
Use these metrics to catch blur, noise, and compression artifacts. They’re good diagnostic tools for visual defects, but they do not measure text alignment or temporal consistency.
Metrics for Text Alignment, Motion, and Temporal Consistency
Alignment metrics check something frame-level scores miss: does the video actually follow the prompt? That’s the gap this group of metrics tries to fill.
CLIP-Based and Video-Aware Semantic Alignment Scores

FVD, SSIM, PSNR, and LPIPS can tell you about visual quality and similarity. They can’t tell you whether the model showed what the prompt asked for. That’s where alignment metrics come in.
CLIPScore takes embeddings from the text prompt and from video frames, then measures cosine similarity between them. It’s fast, simple to run, and often used as a baseline. But it’s also fairly blunt. It can miss motion, spatial relations, and small attributes that matter to viewers [6].
Video-aware variants such as ViCLIP try to fix that problem. They use video-text pre-training, so they can account for motion and time-based context better than plain CLIPScore. For prompts built around actions, these methods tend to match human judgment more closely than standard CLIPScore [1][6].
| Metric | Backbone | Focus Area | Advantages | Known Limitations |
|---|---|---|---|---|
| CLIPScore | CLIP (ViT) | Prompt similarity | Fast; easy to compute; standard baseline | Coarse; misses motion, spatial relations, and fine attributes |
| ViCLIP / UMTScore | Video-text pre-trained CLIP | Temporal and motion context | Better alignment for actions and dynamics | Still relies on embedding similarity; can be sensitive to prompt wording |
When CLIP-style similarity is too broad, VQA-style scoring gives you a closer read on what the prompt asked for.
VQA, Caption-Based Scoring, and Prompt Understanding
Embedding similarity has limits. Two videos can sit close together in embedding space and still differ in ways a person would notice right away.
VQA-based approaches deal with that by breaking prompts into small questions about entities, attributes, and relations. A multimodal LLM then answers those questions based on the video.
ETVA is a good example. It splits prompts into atomic questions and answers them with a multimodal LLM, which improves agreement with human judgment [6]. On this task, ETVA reached a Spearman correlation of 58.47 with human judgment, compared with 31.0 for VideoScore and 13.8 for CLIPScore [6].
Caption-based methods, such as BLIP-BLEU, take a different route. They generate a caption for the video and compare that caption with the prompt using BLEU or ROUGE. That can work for surface-level matching, but it may miss more complex motion and scene changes [6].
Optical Flow and Benchmark-Based Temporal Consistency Measures
Semantic alignment tells you what appears in the video. Temporal consistency tells you whether that content stays stable from frame to frame.
Subject consistency is often measured with DINO feature similarity across frames. If a person’s face shifts over time or an object changes appearance for no good reason, the score falls. Background consistency uses CLIP feature similarity across frames to spot odd shifts in the background [1].
Optical flow, often estimated with RAFT, measures motion magnitude and flow consistency. This matters because some models, like MiniMax Hailuo 02, look stable simply by making videos almost static. That can make consistency numbers look better than they deserve. The DEVIL protocol reported a Pearson correlation above 90% between its dynamics evaluation and human ratings [3]. It also found a strong negative correlation between Subject Consistency and dynamics, at -88.9 Pearson correlation, which shows a common tradeoff: high-motion videos can score worse on consistency even when the motion itself is right [3].
Temporal flickering is measured more directly by computing the mean absolute difference between consecutive frames. VBench includes this as one of its 16 evaluation dimensions [1].
Put together, these checks help track motion, drift, and flicker. On their own, each metric only shows part of the picture, which is why they’re often used alongside benchmark suites and human ratings.
Benchmark Suites and Human Evaluation Methods
When single metrics point in different directions, benchmark suites give you a shared way to judge results. Instead of leaning on one score, they bundle several signals into one setup, which makes cross-study model comparisons much easier.
VBench, T2VEval, and T2VScore as Multidimensional Benchmarks
VBench, T2VEval, and T2VScore all try to judge more than one thing at once. But they don't do it in the same way. VBench and T2VScore look at alignment, quality, and time-based behavior in one rubric, while T2VEval adds a separate realness dimension that the other two don't isolate on its own.
VBench breaks evaluation into 16 hierarchical dimensions, split across video quality and video-condition consistency. Each dimension is tested with about 100 prompts [1].
T2VEval organizes quality into four top-level dimensions:
- overall impression
- text-video consistency
- realness
- technical quality
That split matters. A video can look polished from a technical standpoint and still feel fake. T2VEval-Bench includes 1,783 videos generated by 13 different models, including Sora, Runway Gen-3, and Kling [5].
T2VScore narrows things down to two dimensions: text-video alignment and video quality. It uses Visual Question Answering (VQA) for alignment and a mixture of experts for quality. The two dimensions have a Spearman's ρ of 0.223, which shows they don't move together very closely and should be scored separately [7].
| Benchmark | Dimensions Measured | Key Components | Best Use Case |
|---|---|---|---|
| VBench | 16 dimensions (e.g., subject consistency, motion smoothness, temporal flickering, aesthetic quality) | DINO, CLIP, RAFT, MUSIQ, GRiT, ViCLIP | Best for diagnosing specific strengths and failure modes [1] |
| T2VEval | 4 dimensions (overall impression, consistency, realness, technical quality) | Multi-branch fusion with Swin-3D, ConvLexNet-3D, and BLIP | Best for broad quality assessment, including realism [5] |
| T2VScore | 2 dimensions (text-video alignment, video quality) | VQA, mixture of experts | Best for fast screening of prompt alignment and visual quality [7] |
Human Evaluation Protocols Such as T2VHE
Automated benchmarks are broad. Human review catches the stuff they miss.
People spot physics errors, anatomy mistakes, and commonsense failures almost at once. A metric may not care that water should splash but doesn't. It may also miss an arm bending in a way no human body can. Human judges don't miss those so easily.
T2VHE (Text-to-Video Human Evaluation) is a standard protocol for human assessment. It puts weight on annotator training, clear scoring rules, and example pairs that help calibrate judgment. It also uses a dynamic scoring scheme that can cut manual annotation needs by about 50% [5].
| Feature | Objective Metrics (e.g., VBench, T2VScore) | Human Evaluation (e.g., T2VHE, MOS) |
|---|---|---|
| Coverage | High volume; can process thousands of videos | Limited by annotator hours |
| Cost | Low (computational resources only) | High (requires recruited, compensated annotators) |
| Speed | Near-real-time once models are trained | Days to weeks for large datasets |
| Nuance | May miss subtle violations of physics or common sense | Excellent at detecting commonsense errors and subtle distortions |
| Best Fit | Iterative model development and rapid testing | Final validation and gold-standard comparisons |
That split sets up the next decision: picking the right metric stack for the workflow. This is especially critical when testing high-performance models like Grok Imagine Video.
Applying These Metrics in Text-to-Video Workflows
Choosing a Metric Stack for Real-Time and Offline Evaluation
The main idea is simple: match the metric to the job.
At each stage of a text-to-video pipeline, you want a different kind of signal. Use alignment metrics to check whether the video fits the prompt. Use perceptual scores to judge frame quality. Then use motion metrics to see whether the video stays stable over time.
For live monitoring, stick with lightweight semantic alignment and visual-quality scores. They’re easier to run and fit better when speed matters. For offline work, the bar is different. If you’re comparing models, setting release gates, or tracking quality drift over time, heavier benchmarks like FVD and VBench make more sense [4][1].
Motion adds another layer. If a video has camera movement or moving foreground objects, motion- and tracking-aware metrics matter a lot. Standard scores can miss things that humans notice right away, like background drift or shaky object behavior.
How Unified API Platforms Such as APIMart Can Use Evaluation Metrics

The same metric stack can also support platform-level routing and quality control.
A unified AI API platform like APIMart can use these metrics to route prompts, gate outputs, and keep quality checks aligned across workflows. That matters when one platform is working with many models and use cases at once. You don’t want each workflow judging output by a different yardstick.
Metric-based routing can help send each prompt to the model that fits it best. For monitoring over time, Conditional Fréchet Distance (cFreD) stands out because it does not need retraining and can track generative distribution drift in a plug-and-play way [8].
Conclusion: What Current Metrics Do Well and Where Research Is Still Open
Taken together, these metrics work best as a stack, not as a single score.
No one metric can tell the whole story. Good evaluation means combining video quality scores, text alignment measures, motion and temporal consistency checks, and human judgment at key validation points.
Current metrics do a decent job covering frame quality, semantic alignment, and temporal consistency. The harder problem is getting better coverage and clearer explanations without adding latency. LMM-based assessors look promising here because they can explain why a video failed in natural language [2]. That said, they fit offline review better than live monitoring right now.
FAQs
Why isn’t one metric enough?
No single metric can do the whole job because text-to-video quality has more than one moving part.
Measures like FVD or IS can say something about technical quality or pattern similarity across outputs. But they often miss semantic consistency, motion over time, what people actually prefer, and whether the video lines up with the text prompt in the first place.
That’s why a better evaluation looks at several dimensions instead of leaning on just one score.
Which metrics should I combine first?
Start with a layered approach that splits quality into two parts: video quality and text-video consistency.
Before you lean on metrics like Inception Score, Fréchet Video Distance, or CLIPSim, first look at both technical and aesthetic quality metrics together. That gives you a baseline for spatial content and cross-frame temporal consistency before you judge how well the video matches the text prompt.
When do I still need human review?
Human review still matters. Automated metrics often miss details that people notice right away, like temporal consistency, semantic alignment, authenticity, realism, or irrational objects.
Objective metrics can give you a solid baseline. But they don't reliably match actual quality or human perception. That's why user studies are still needed: there isn't one automatic measure that can catch all of these details.
Choose the model you want in the model marketplace
Try chat, image and video models in the APIMart model marketplace, and experience model capabilities quickly with one unified API.