
Top 7 Metrics for Multi-Modal AI Evaluation
Measure multimodal AI with seven production-focused metrics—quality, latency, scalability, safety, cross-modal alignment, user experience, and cost telemetry.
If I had to cut this down to one idea, it would be this: I would never judge a multimodal AI system by accuracy alone. A model can score well and still fail on latency, grounding, safety, or cost per successful task. And those misses show up fast in production.
Here’s the short version:
-
I’d check 7 metrics together: quality, latency, scale, safety, alignment, UX, and cost
-
I’d track tail latency, not just averages, because a 900 ms average can still hide 8+ second p99 delays
-
I’d measure hallucination and visual reliance, because some models sound right while barely using the image
-
I’d use cost per successful task, not per-call price, since retries, moderation, and storage can push spend up fast
-
I’d rerun a frozen set of 100 to 500 live examples after each model update to catch drift early
For me, the point is simple: the best multimodal model is not the one with the top benchmark score. It’s the one that stays accurate, grounded, fast enough for users, safe under messy input, and within budget in U.S. dollars ($).
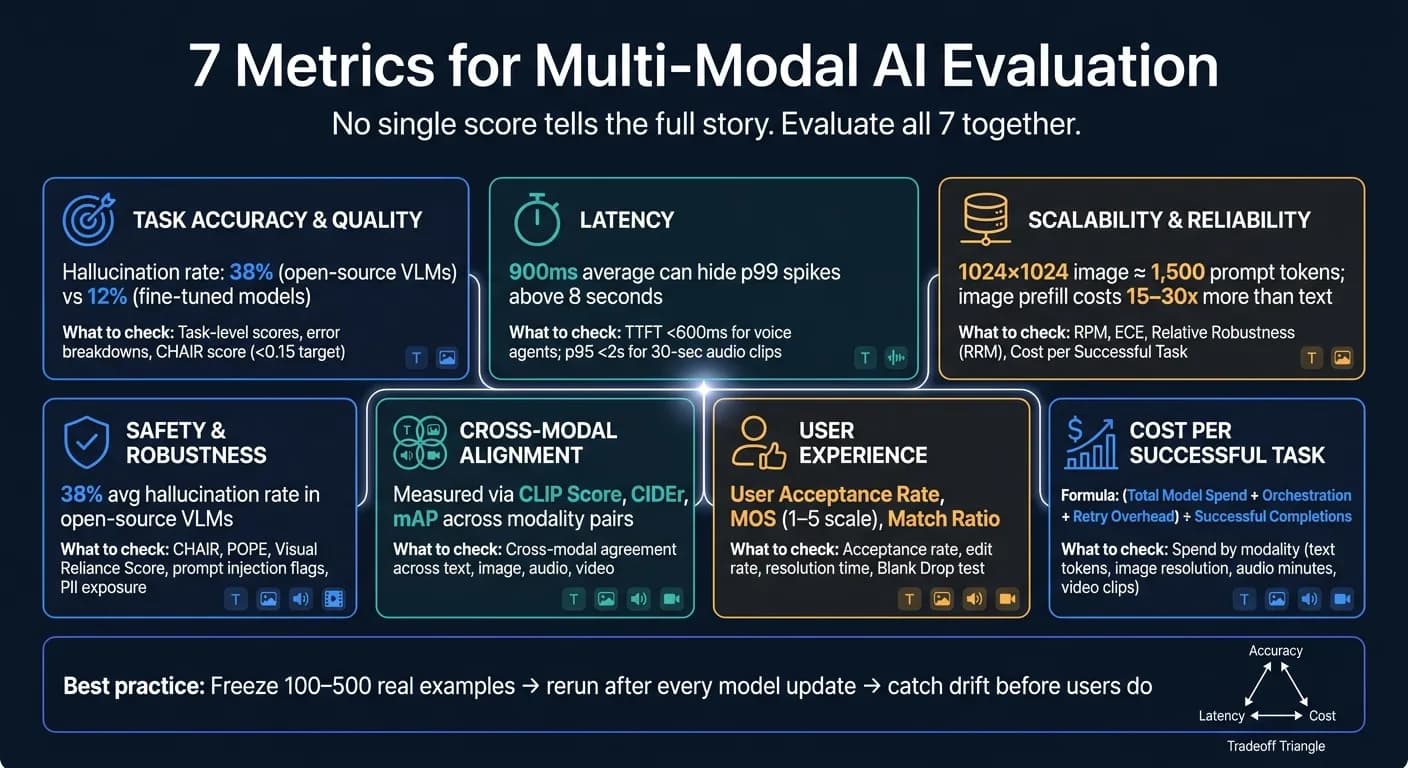
MultiModal LLM Evaluation: Best Techniques and Common Mistakes
Quick Comparison
| Metric | What I’d check | Why it matters |
|---|---|---|
| Task accuracy | Task-level scores, error breakdowns, hallucination rate | Shows if the model gets the job right |
| Latency | TTFT, p95, p99, full request time | Shows if users will wait or leave |
| Scale | Throughput, error rate, calibration, cost per task | Shows if the system holds under load |
| Safety | Grounding errors, prompt injection, PII risk | Shows if output can cause harm or legal risk |
| Alignment | Cross-modal agreement across text, image, audio, video | Shows if the system keeps the same meaning across inputs |
| UX | Acceptance rate, edit rate, MOS, resolution time | Shows if people will actually use the output |
| Cost | Spend by modality, retries, storage, moderation | Shows if quality can hold without overspending |
If I were setting up evaluation today, on July 6, 2026, I’d treat these seven checks as one scorecard - not seven separate reports.
Why Multi-Modal Evaluation Needs More Than One Metric
One score can't tell you if a multimodal system will hold up in production.
A model might post a strong score and still be too slow to use. Or it might sound smooth and polished while missing what's actually in the image. That's the trap: a single number can hide the exact kind of failure that will cause problems later.
The weak spots also change from task to task. An invoice model might read the text correctly but miss the layout, then pull the wrong invoice total. A voice assistant might transcribe the words with high accuracy but still miss tone. Those are very different mistakes, which is why evaluation needs to split into separate metrics instead of squeezing everything into one score.
"Evaluating multimodal systems requires a paradigm shift. Text-only evaluation metrics like BLEU or accuracy are insufficient... evaluating multimodal systems requires metrics that are sensitive to alignment between modalities, not just performance within each modality independently." - eval.qa [8]
There's also the cost side. Better grounding can push up per-inference pricing, so cost control needs to be part of evaluation from the start, not something you look at after deployment. If a model is accurate but too expensive, it still fails in production.
The seven metrics below cover those checks.
1. Task Accuracy and Quality Scores
Start with task-specific quality. A multimodal model can look strong on paper and still struggle on the one output type you care about.
The table below lines up common multimodal tasks with the main metrics used to judge them, so you can match the measurement to the job:
| Task | Primary Metric | Secondary Metric | Best Use Case |
|---|---|---|---|
| Image Captioning | CIDEr | SPICE, BLEU-4 | Describing visual scenes |
| Visual Grounding | Accuracy@IoU | mAP | Pinpointing objects in images |
| Document AI | ANLS | Exact Match, F1 | Extracting text from invoices/forms |
| Image Generation | FID | CLIPScore | Text-to-image synthesis |
| Speech-to-Text | WER | CER | Transcribing audio recordings |
| Video QA | Accuracy | CIDEr-D | Understanding temporal actions |
Aggregate scores can gloss over weak spots. For example, a Visual Question Answering (VQA) model might hit 95% on simple color questions, then fall to 40% on harder reasoning tasks. That's a huge gap. So before you trust the headline number, break accuracy out by question type.
Top VQAv2 scores now exceed 85%, which means the benchmark is less of a separator and more of a baseline check [3].
You should also track hallucination on its own. Open-source VLMs average 38%, while leading models are near 12% [8]. The CHAIR metric (Caption Hallucination Assessment with Image Relevance) measures this directly. In many production settings, a score below 0.15 is a good target [8].
For production monitoring, keep a frozen internal set of 100–500 real examples and rerun it on a regular schedule. That's one of the simplest ways to spot quality drift before it turns into a user-facing problem.
Once quality clears the bar, the next step is checking whether the model can deliver that quality fast enough for production.
2. Latency, Response Time, and Throughput
Latency is the time to first usable output. Response time is the full end-to-end wait a user experiences. Throughput is how many requests or tokens a system can handle per second.
With multimodal systems, these numbers can change fast.
A 1024×1024 image can use about 1,500 prompt tokens, and image prefill can cost 15–30x more than a standard text request [11]. Video is heavier still. A 10-minute clip sampled at 1 frame per second can use around 153,600 tokens [11]. In many cases, the slowdown starts before inference. Resizing, transcoding, and frame extraction often become the main choke point.
That’s why averages don’t tell the whole story. Measure latency with percentiles, not averages, because averages can hide nasty tail spikes [9].
A system might show a 900 ms average and still hit p99 spikes above 8 seconds [7]. And for products like voice assistants or live captioning, that tail latency is what people notice. A short pause feels minor. An 8-second stall feels broken. Target Time to First Token (TTFT) under 600 ms for voice-based agents [12], and set modality-specific SLOs. For example:
-
p95 under 2 seconds for 30-second audio clips
-
p95 under 10 seconds for 30-minute audio files [7]
| Metric | Text | Image/Video | Audio |
|---|---|---|---|
| Primary latency focus | Time to First Token (TTFT) | Preprocessing & rendering time | Upload & speaker separation time |
| Throughput risk | Token-heavy outputs | Large artifact storage/bandwidth | Concurrent stream processing |
| Latency-sensitive workloads | Real-time chat/assistants | Safety-critical (e.g., AV) | Live captions/call centers |
In production, measure the full request path, not just model inference. Log each stage: media upload, preprocessing, prompt assembly, network transit, post-processing, and validation. If latency jumps, you need to see whether the delay came from the model itself or from something upstream, like a transcoding step.
It also helps to test traffic bursts before launch. Benchmark at 2x and 5x your expected peak load to catch throughput drop-offs and timeout spikes before they hit production [13].
If speed holds, the next question is whether the system stays reliable and efficient at scale.
3. Scalability, Reliability, and Resource Efficiency
A model can look fast on its own and still fall apart when traffic hits. Scalability means steady throughput during traffic spikes. Reliability means steady output when inputs get messy, noisy, or drift from what the model saw before. Resource efficiency means doing both without burning money or compute for no good reason. That's the big difference between a lab test and a production test.
Once you know a system can handle scale, cost becomes the next limit. And this is where teams often get tripped up. API price alone doesn't tell you what you'll pay in production. The real formula looks more like this:
Estimated cost = input cost + output cost + modality processing cost + retry cost + moderation cost + orchestration cost [13]
So don't stop at token pricing. Measure total cost per successful task, with retries, moderation, and orchestration included. Multimodal requests can add a lot of token and payload overhead, which means efficiency is about more than the sticker price of the model. [13][2]
For reliability, track error rates, but don't stop there. You also want calibration and robustness under noisy or shifted inputs. Expected Calibration Error (ECE) checks whether a model's confidence matches how often it's right. If a model says it's 70% confident, it should be correct about 70% of the time. Relative Robustness (RRM) can be calculated as $(\text{acc}{\text{corrupted}} - \text{acc}{\text{random}}) / (\text{acc}{\text{clean}} - \text{acc}{\text{random}})$ [18]. These metrics matter a lot in high-stakes settings like medical document understanding or financial invoicing, where a smooth-sounding wrong answer can do real harm. [17][6]
On the efficiency side, keep the routing logic simple. Send easy requests to smaller models. Lower image resolution or sample fewer video frames when tiny details don't matter. [16][13] And for heavy tasks like video indexing, split synchronous and asynchronous paths. That way, large jobs don't clog up interactive user flows.
| Sub-Metric | What It Measures | Why It Matters |
|---|---|---|
| Requests per Minute (RPM) | Throughput at a quality threshold | Readiness for peak traffic and batch jobs |
| Expected Calibration Error (ECE) | Confidence vs. actual accuracy gap | Catches overconfident or underconfident outputs |
| Relative Robustness (RRM) | Performance drop under noisy inputs | Shows how much performance degrades under corrupted inputs |
| Cost per Successful Task | Total cost ÷ successful outcomes | True unit economics, not just API pricing |
| Abstention Rate | Frequency of model refusals or deferrals | Flags noisy or out-of-distribution inputs |
One simple check is a blank-drop test: remove the image and measure how much accuracy falls. If performance barely moves, the visual input may not be doing enough to earn its processing cost. [6] After scale and efficiency, the next step is to see what happens when inputs get sloppy, strange, or openly adversarial.
4. Robustness and Safety Across Modalities
Once speed and scale are in a good place, the next step is simple: check whether the model still follows the input when things get messy.
Robustness means the model can keep working under noisy, odd, or messy inputs. Safety means it avoids harmful, misleading, or ungrounded output. In multimodal AI, both are tougher than in text-only systems because each modality can fail in its own way.
The failure patterns aren’t the same across inputs. Images can cause text-overlay or spatial mistakes. Audio can hide prompt injections. Video can scramble temporal order. [10] And the worst-case scenario isn’t a crash or an obvious miss. It’s a smooth, confident answer that quietly ignores the input.
That’s not a small issue. Open-source VLMs hallucinate at an average rate of 38%, while fine-tuned commercial models have pushed that down to about 12%. [8]
"The most unsettling multimodal finding is not that models sometimes fail. It is that they can appear to work while barely using the visual input at all." - Conor Bronsdon, Head of Developer Awareness, Galileo [6]
For evaluation, don’t stop at plain accuracy. You want metrics that show when grounding breaks.
-
Use CHAIR to measure caption hallucinations.
-
Use POPE to test yes/no grounding errors.
-
Track a Visual Reliance Score by comparing results on correctly matched image-question pairs with mismatched pairs. If the gap is small, the model may be paying little attention to the visual evidence. [8][18][6]
On the safety side, keep a close eye on cross-modal prompt injections and PII exposure, especially in regulated fields like healthcare and finance. Track blur, ambiguity, and prompt-injection flags at input. Then filter outputs before delivery. For flagged, high-stakes cases, use human review. [6][2][4]
5. Cross-Modal Consistency and Alignment
After robustness, the next thing to check is whether the modalities still point to the same meaning.
Cross-modal consistency asks a simple question: if you give the same intent through text, image, audio, or video, does the system give the same answer? Alignment asks whether those modalities connect to the same concepts [19][1][15]. If one request leads to different answers across text, audio, or vision, trust starts to fall apart fast [15][19].
At the core, the failure pattern is pretty much the same across use cases: the AI model has to ground one concept the same way across modalities [2].
Use metrics that fit the output type, but keep the focus on cross-modal agreement:
| Use Case | Primary Metrics | What They Measure |
|---|---|---|
| Image Captioning | CIDEr, SPICE, CHAIR | Semantic quality; hallucinated objects vs. total objects |
| Image Generation | CLIP Score, FID | Text-to-image alignment; overall visual realism |
| Search & Retrieval | Recall@K, mAP, CLIP Score | Whether the correct item appears in top-K results |
| Video Generation | CIDEr-D, Action Recognition | Temporal consistency; Top-1/Top-5 action accuracy |
One score alone won't tell you much. Break results out by modality pair so you can see where text, image, audio, or video starts to drift [8].
Production data helps here too. Watch for user edits and rejections. Those signals often catch alignment problems that formal metrics miss [2].
A multimodal LLM judge can rate alignment well, but there's a tradeoff: more latency and more cost [2]. For day-to-day monitoring, simple checks usually do the job. Save judge-based scoring for high-risk requests [2].
Once outputs stay aligned, the next step is to see how they hold up in actual interaction.
6. User Experience and Interaction Quality
Once outputs stay in sync across modalities, UX metrics tell you if that holds up with actual users. The main problem here is the eval gap: output that sounds smooth but doesn't deal with the input. These metrics show whether alignment survives contact with real users, not just neat benchmark prompts.
User acceptance rate - how often users accept AI output without editing or rejecting it - is one of the clearest production signals [2]. It picks up quality problems that benchmarks can miss completely. Use Blank Drop only as a user-facing check to confirm that acceptance comes from real grounding, not text-only guessing.
For voice and media tasks, perception-based metrics matter just as much as acceptance rates. Mean Opinion Score (MOS) on a 1–5 scale measures perceived naturalness for audio and video workflows. For document-heavy or instruction-following tasks, Match Ratio (MR) - the share of outputs that follow format and constraint rules - shows how reliably the model respects user intent [18].
The table below maps the most useful UX sub-metrics to what they measure and why they matter:
| Sub-Metric | What It Measures | Why It Matters |
|---|---|---|
| User Acceptance Rate | How often users accept vs. edit/reject AI output | Direct signal of real-world utility |
| Blank Drop | Accuracy loss when the image is removed | Confirms the model is actually using the visual input |
| Match Ratio (MR) | Share of outputs following format and constraint rules | Measures instruction-following reliability |
| Mean Opinion Score (MOS) | 1–5 naturalness rating for audio/video output | Tracks user-perceived quality in voice and media workflows |
| Resolution Time | Time for a multi-modal agent to complete a task end-to-end | Directly impacts satisfaction in interactive sessions |
Running a full multimodal judge on every request isn't practical at scale. A better fix is adaptive sampling: run expensive multimodal judges on a representative sample of traffic so UX monitoring stays workable [6][7]. Then send flagged outputs to human review.
After UX, cost determines whether the experience can hold up at scale.
7. Cost, Pricing, and Usage Telemetry
Once the user experience is in good shape, cost decides whether you can keep that quality at scale. That’s why cost sits near the center of any model review. And with multimodal systems, the math gets more complicated fast because text, image, audio, and video each have their own pricing patterns.
Track cost by modality: per image, per audio minute, and per video clip. And don’t stop at inference alone. You also need to count preprocessing, storage, logging, redaction, bandwidth, retries, and moderation [20][14].
The metric that tends to shape production choices is cost per successful task:
(Total Model Spend + Orchestration Cost + Retry Overhead) / Successful Completions[5][13]
This matters because a model can look cheap on a per-call basis and still turn expensive once retries and human review start piling up [9][20]. Video is where this often hits hardest. Storage, rendering, and bandwidth for large artifacts can add up in a hurry [14]. APIMart supports video, image, and language models, so it helps to track cost per second of video output apart from text token costs. That split gives you a much clearer read on where your money is going.
Usage telemetry helps you spot budget drift before it shows up on the monthly bill. In plain English, telemetry turns cost from an accounting line item into something you can manage day to day. Here’s how the main signals and cost drivers break down by modality:
| Modality | Key Telemetry Signals | Primary Cost Drivers |
|---|---|---|
| Text | Input/output tokens, prompt length, retry rate | Token volume, context window size |
| Image | OCR extraction success, prompt iterations, resizing time | Resolution, preprocessing, moderation |
| Audio | Real-time media minutes, transcription accuracy, synthesis cost | Audio duration, STT/TTS processing |
| Video | Transcoding cost, frame extraction rate, cost per usable second | Temporal reasoning, render time, storage |
Keep an eye on sudden jumps in prompt length, image resolution, or retry rates. Those shifts can push spend up fast even when performance numbers look steady [20]. To bring down cost per successful task, use tiered inference, downsample image resolution, sample fewer video frames, and trim context that doesn’t help the task [16][13].
Quick Metric Comparison Table
Use the table below to compare the seven metrics side by side before you set thresholds. Each row sums up one metric covered above.
| Metric | What It Measures | Why It Matters in Production |
|---|---|---|
| Task accuracy / quality score | Correctness and output quality per task type | Spots repeat errors in classification and grounding [5] |
| P99 latency | Tail response time (99th percentile) | Checks that worst-case performance still meets SLAs [5] |
| Scalability / reliability / resource efficiency | Availability, error rate, throughput under load, and compute use | Makes sure the system stays steady and efficient during peak traffic [5][4] |
| Robustness / safety | Noisy-input tolerance and harmful output prevention | Helps avoid high-stakes failures and legal risk [5] |
| Cross-modal consistency / alignment | Cross-modal grounding fidelity (for example, CLIP Score) | Helps catch fluent but ungrounded hallucinations [5][6] |
| User acceptance / satisfaction | Acceptance rate and perceived output naturalness | Reflects the kind of subjective quality people actually care about [8] |
| Cost per successful task | Total spend normalized by successful completions | Keeps performance and control costs in balance [5][3] |
How to Apply These Metrics in Practice
The biggest mistake teams make is judging a model by one metric. That almost always leads to bad calls.
The seven metrics in this article - quality, speed, scale, safety, alignment, UX, and cost - work best together. The hard part, and the part that matters most, is the tradeoff between them. That’s where decisions get made. Your next move is to turn those metrics into clear thresholds and weights.
Start by setting your Service Level Objectives (SLOs) before you run even one benchmark. Define latency thresholds for each workload, and normalize budget using cost per successful task instead of sticker price [9][5].
Then build a weighted scorecard that links each metric to the job you need done. A contact center should put the most weight on transcription accuracy and latency. A design studio should care more about image fidelity and prompt adherence.
There are three tradeoffs worth watching closely:
-
Accuracy
-
Latency
-
Cost
In interactive workflows, small gains in accuracy usually aren’t worth big penalties in latency or cost [3]. And if you weaken safety filters to cut latency, that risk doesn’t stay small - it grows at scale [8].
After every model update, rerun the same frozen test set. Model versions change often, and an update that helps accuracy can quietly hurt latency or safety. Set a monthly re-benchmark cadence. APIMart can centralize reruns across text, image, and video models.
Conclusion
These seven metrics - task accuracy, latency, scalability, safety, cross-modal alignment, user experience, and cost - cover the main tradeoffs in multimodal evaluation. When you look at them together, model selection becomes a much clearer production call. And the metrics that matter most will depend on what your business needs to do.
Before you pick a model, build a repeatable evaluation framework. Set minimum thresholds for safety, grounding, latency, and cost per successful task [5]. Then run that same test set again after every model update.
That part matters more than it may seem. A model can look strong on a benchmark and still miss your latency budget or fail safety checks at scale. If that happens, it’s not the right fit, no matter how good it looks on paper.
For U.S. teams in regulated fields like healthcare or finance, the framework also needs to account for PII exposure risks and human review at key decision points.
The goal isn’t to max out every metric. It’s to find the model that clears your quality gates, fits your workload, and stays within budget - then keep a close eye on it so you can catch drift before users do. APIMart can centralize evaluation across text, image, and video models.
FAQs
::: faq
How should I prioritize these seven metrics?
Start by defining your product tasks and acceptance thresholds instead of leaning on generic benchmarks. Tie each real-world job to clear success criteria, like latency limits or accuracy needs, before you pick a model.
Then evaluate in layers. Check input understanding and grounding first. After that, measure cost and latency under production load.
For high-volume tasks, use fast automated checks. For high-value or ambiguous cases, add targeted human review or LLM-as-a-judge validation. :::
::: faq
What should my first evaluation scorecard include?
Your first evaluation scorecard should focus on task-specific metrics, not generic benchmarks. Start with the exact use case, like document extraction or image question answering.
Include:
-
Accuracy and quality for each modality
-
Operational metrics such as p50/p95 latency and total cost
-
Dependence checks to confirm the model is using the input media
-
Robustness and safety with noisy, edge-case, and adversarial examples :::
::: faq
How often should I re-test a multimodal model?
Re-test your multimodal model any time prompts, preprocessing, or the base model version changes. That helps keep results repeatable.
Multimodal systems can break in ways text-only checks won't catch. So don't stop at static tests. Run offline benchmarks on fixed datasets, then use constrained shadow deployments or canary workloads to verify live latency and throughput. APIMart can help keep evaluation consistent across multimodal workflows. :::
Choose the model you want in the model marketplace
Try chat, image and video models in the APIMart model marketplace, and experience model capabilities quickly with one unified API.