Predictive Sales Analytics for E-commerce
Explore 8 predictive sales analytics use cases for e-commerce—demand forecasting, inventory, pricing, churn, and revenue planning—that drive growth.
If you want better e-commerce growth, start with prediction that leads to action. This article shows that predictive sales analytics helps you make better calls on inventory, pricing, recommendations, retention, abandoned carts, and revenue planning.
I’d boil it down like this:
- Demand forecasting helps you avoid missed sales and excess stock.
- Inventory planning turns forecasts into reorder points and safety stock.
- Dynamic pricing helps balance conversion, margin, and sell-through.
- Recommendations and cross-sell/upsell help lift AOV and conversions.
- Churn prediction helps you act before repeat buyers leave.
- Cart abandonment scoring helps recover orders before checkout fails.
- Revenue forecasting helps line up marketing spend, inventory, and merchandising.
A few numbers stand out right away:
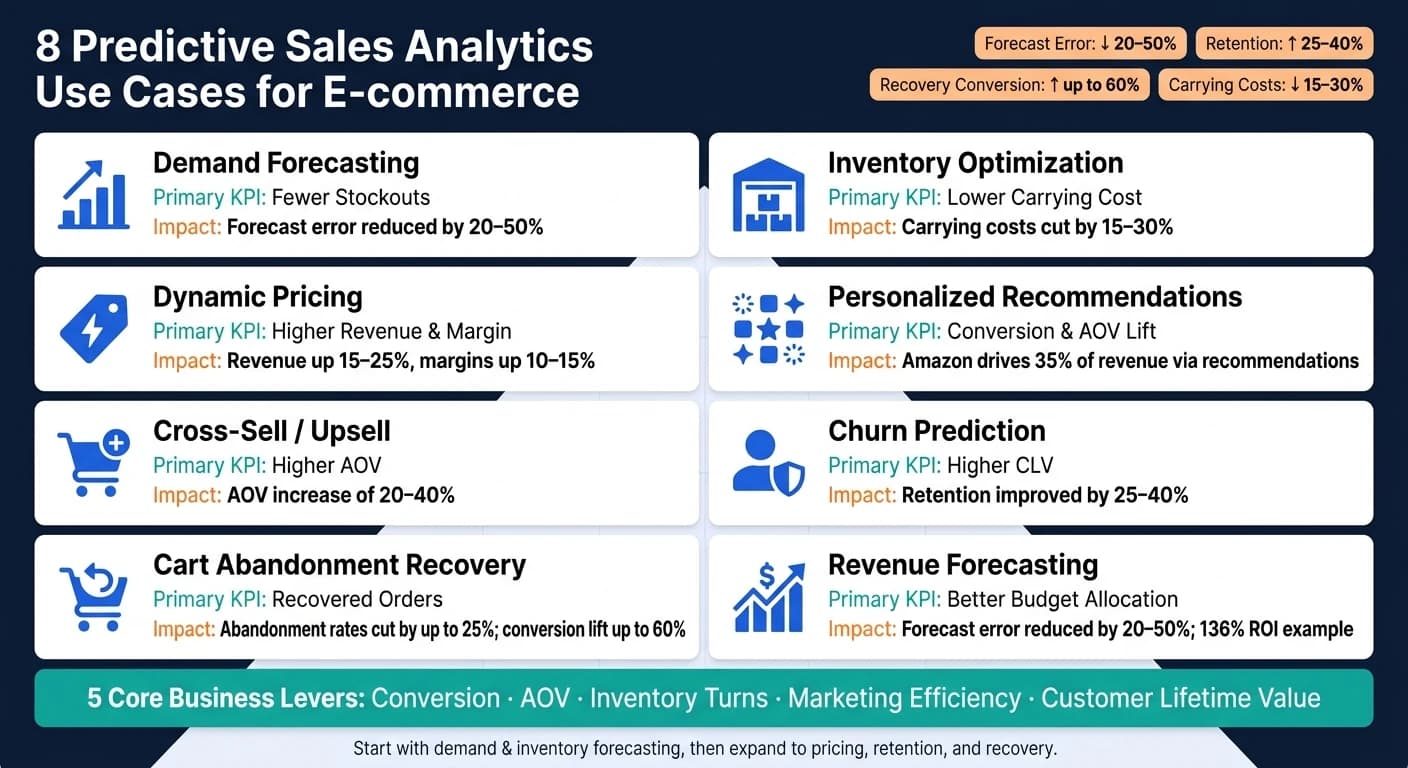
- Forecast error can drop by 20% to 50%
- Inventory carrying costs can drop by 15% to 30%
- Retention can improve by 25% to 40%
- Personalized recovery and offer flows can lift conversion by up to 60%
Demand Prediction Using Machine Learning for Retail E-Commerce Analytics
Quick Comparison
| Use case | Main goal | Main KPI |
|---|---|---|
| Demand forecasting | Predict future sales by SKU, channel, and time | Fewer stockouts |
| Inventory optimization | Set reorder points and safety stock | Lower carrying cost |
| Dynamic pricing | Set price and discount levels | More revenue and margin |
| Recommendations | Suggest the next item a shopper may want | More conversion |
| Cross-sell/upsell | Show add-ons or upgrades | Higher AOV |
| Churn prediction | Flag buyers likely to stop purchasing | Higher CLV |
| Cart abandonment | Spot checkout drop-off risk | More recovered orders |
| Revenue forecasting | Predict sales dollars by period and channel | Better budget use |
What I like about this piece is its main point: a model only matters when a team can use it. So if you’re deciding where to start, the safest first move is usually demand and inventory forecasting, then expand into pricing, retention, and recovery once your data and workflow are in place.
Why Predictive Analytics Matters for U.S. E-commerce Growth
U.S. e-commerce demand changes fast. It swings by region, season, and local buying patterns. That’s why predictive analytics matters: it helps teams make moves before a trend tops out.
The business case is pretty simple. It comes down to five levers:
- conversion
- AOV
- inventory turns
- marketing efficiency
- customer lifetime value
You’ll see these same five levers show up in the use cases that follow.
AI-driven forecasting can reduce forecast errors by 20% to 50% and cut inventory carrying costs by 20% to 30% [6]. That’s a big deal for any U.S. e-commerce team trying to keep stock levels tight without missing sales.
That’s also why the next use cases focus on forecasting, pricing, and retention decisions.
The first use case is demand forecasting.
1. Demand Forecasting
Demand forecasting sits at the base of every sales decision that comes after it.
Primary Prediction Target
The main target is future customer demand at the SKU-channel-day level. The right forecast granularity depends on the decision you need to make. For replenishment, use SKU by channel by day. For planning, category by month is often enough. That level of precision is what turns a forecast into an actual reorder call.
Core E-commerce Data Inputs
Strong forecasts pull from four main data sources. That usually includes sales history, promotions, ad spend, stockouts, behavioral signals, and outside data like weather and search trends. Behavioral signals such as add-to-cart rates and page views often show movement before sales do.
One point matters more than it may seem: stockout periods need to be masked. Zero sales during an outage do not reflect true demand.[1]
Measurable Sales Impact
AI demand forecasting can cut forecast error by 20% to 50%, reduce lost sales by up to 65%, and lower carrying costs by 15% to 25%.[1][2]
The payoff shows up fast when teams act on the signal. In March 2025, a Midwest outdoor retailer used Cogsy's demand sensing alerts to catch a 300% spike in portable generator demand in real time. The team replenished inventory before a full stockout and saved an estimated $150,000 in lost orders.[1]
A second case tells a slightly different story. Ardent Supply Co., a seven-figure outdoor accessories brand, cut overstock carrying costs by 22% in one year after moving to Inventory Planner and tagging past Klaviyo email campaign data to separate promo-driven spikes from organic demand.[2]
Typical Activation Channel
A forecast only matters if it drives action. In practice, it should trigger:
- purchase orders
- safety stock updates
- warehouse allocation
From there, forecasting feeds inventory optimization and replenishment planning.
2. Inventory Optimization and Replenishment Planning
Primary Prediction Target
Inventory optimization turns a forecast into a buying decision: how much to stock, where to place it, and when to reorder. That’s what makes forecasting useful in day-to-day operations instead of just a nice report.
The main prediction targets are dynamic reorder points, safety stock levels, and time-to-stockout estimates. And they need to be set at the SKU variant level - size, color, and style - not at the parent product level. That detail matters. If you average demand across variants, you can miss the items that are about to run out while others sit on the shelf.
Core E-commerce Data Inputs
The inputs matter just as much as the model. Use actual purchase-order-to-receipt times instead of quoted lead times, because delivery swings matter more than a simple average. Mark stockouts clearly so the model can tell the difference between lost demand and true demand. For apparel and electronics, train on net demand so returns don’t push you into overbuying.
Measurable Sales Impact
Overstocks and stockouts cost the global economy more than $1.73 trillion per year [6]. That’s the big-picture cost. At the store level, the math is just as blunt: AI-optimized forecasting can cut stockout rates from the 5% to 8% range down to 2% to 3%, and each percentage point of stockout rate equals about 1% in lost sales [12].
| Metric | Manual Management | AI-Optimized |
|---|---|---|
| Forecast Accuracy | 60–75% | 80–95% [12][13] |
| Stockout Rate | 5–8% | 2–3% [12] |
| Inventory Turnover | 4–6x annually | 6–9x annually [12] |
The table shows the pattern. The next example shows what that can look like in practice.
In November 2025, a Chicago electronics distributor cut forecast error by 34% and freed $2.8 million in cash after adding weather and competitor pricing to its model [6].
Typical Activation Channel
Reorder signals usually feed into ERP or WMS automation, safety-stock updates, and multi-channel allocation across fulfillment networks such as Amazon FBA, Walmart WFS, and TikTok Shop.
The teams that run this well don’t leave the risk level vague. They set a clear service target - for example, a 95% in-stock probability for bestsellers - so the model knows what standard it needs to hit. Those inventory choices then feed straight into pricing and promotion in the next use case.
3. Dynamic Pricing and Promotion Optimization
Primary Prediction Target
After inventory is locked in, pricing becomes the lever that shapes revenue, margin, and sell-through. Most models focus on three prediction targets: the right price point, the right discount depth, and the likelihood of purchase. This use case has a direct effect on conversion rate and average order value.
Core E-commerce Data Inputs
Good pricing models pull from several data sources at once: historical sales, inventory levels, competitor pricing, LTV, session behavior, and traffic-source data. That last one matters more than people sometimes think.
Here’s why: shifts in channel mix can blur the effect of pricing. If conversion rates move because more visitors are coming from paid social instead of organic search or direct traffic, it’s easy to give pricing credit for a change it didn’t cause.
Measurable Sales Impact
AI pricing can increase revenue by 15% to 25%, improve margins by 10% to 15%, and shrink pricing cycles from weeks to hours [15][16][18]. But those gains don’t happen by magic. They depend on how fast predictions make their way into the storefront, marketplace, or campaign engine.
Typical Activation Channels
Predictions don’t just sit in a dashboard. They feed straight into day-to-day execution, including:
- on-site repricing on product pages
- algorithmic repricing on marketplaces like Amazon and Walmart to help maintain Buy Box position [3][14]
- triggered email and SMS offers based on purchase probability
Regular audits and feedback loops help spot model drift as customer behavior and market conditions shift [6][14].
The same behavioral signals used for pricing can also power personalized recommendations.
4. Personalized Product Recommendations
Recommendations help turn buying intent into more conversions and a higher average order value.
Primary Prediction Target
The main goal is simple: predict the next product a shopper is most likely to buy based on live behavior signals. Graph-based models map relationships between products, customers, and transactions, which helps them surface stronger pairings, like standing desks and premium office chairs [8][20].
Core E-commerce Data Inputs
Good recommendation models rely on both structured data and behavioral data. Purchase history, recency, frequency, monetary scores, and product return patterns show long-term preference. At the same time, clickstream activity, scroll velocity, search query refinements, wishlist additions, and cart interactions reveal what the shopper wants right now [8][17].
Context matters too. Signals like geo-location, device type, traffic source, and seasonality help make recommendations more relevant [8].
Measurable Sales Impact
Amazon gets about 35% of its total revenue from its recommendation engine [8][20]. Across e-commerce, a 10% gain in recommendation relevance often leads to a 1% to 3% lift in total revenue [20].
Graph-based recommendation models also beat collaborative filtering on several core metrics:
| Metric | Collaborative Filtering | Graph-Based AI |
|---|---|---|
| Click-through rate | 2.1% | 3.8% |
| Revenue per impression | $0.42 | $1.14 |
| Cross-category discovery rate | 8% of recommendations | 34% of recommendations |
| New-product coverage | 12% | 78% |
Source: [20]
In 2023, DoorDash deployed graph-based recommendations across its platform and achieved a 1.8% engagement lift across 30 million users, translating to millions in incremental annual revenue [20].
Typical Activation Channels
These recommendations often appear through on-site widgets like "Frequently Bought Together" and "Recommended for You." They also show up in in-app notifications, AI chatbots, and search result re-ranking [8][21][4].
The same intent signals can also power cross-sell and upsell models.
5. Cross-Sell and Upsell Prediction
Primary Prediction Target
Once a recommendation engine figures out what a shopper is likely to buy, cross-sell and upsell models take the next step. Their job is to predict the next-best offer: either a related item or a higher-priced version of the product already in view.
The goal is pretty simple: increase average order value and conversion by showing the right add-on or upgrade at the right time.
Core E-commerce Data Inputs
These models use live shopping signals such as SKU-level purchase history, recency, frequency, and monetary scores, order frequency, loyalty program status, clickstream patterns, scroll velocity, time on page, search query refinements, and real-time cart contents [8][21].
Return history also matters. It can help block poor size or fit suggestions, which improves upsell accuracy. The same inputs can sharpen recommendations during checkout too, where timing often makes all the difference.
Measurable Sales Impact
Automated cross-selling and upselling typically drive 10% to 30% of total e-commerce revenue [21].
AI-powered recommendations can increase average order value by 20% to 40%, while personalized campaigns can lift conversion rates by as much as 60% [15][21].
Typical Activation Channels
Where and when a prediction appears often matters more than the model itself. Brands usually trigger these offers through:
- product-page widgets
- cart offers
- triggered email and SMS
- in-app messages
- chatbot prompts timed to session intent or replenishment cycles [21]
The same purchase and behavior signals used for cross-sell and upsell models can also point to early disengagement, which makes them useful for churn prediction and retention campaigns.
6. Churn Prediction and Retention Campaigns
Primary Prediction Target
Churn models help teams spot customers who are likely to stop buying or cancel a subscription within 30, 60, or 90 days. When the model is calibrated well, it can flag at-risk customers 30 to 60 days before they leave. That gives retention teams a real window to step in.
This matters because keeping repeat buyers is often worth more than chasing new traffic. Instead of waiting for customers to disappear, these signals let teams act early.
Core E-commerce Data Inputs
Churn scores usually pull from a mix of signals:
- recency
- purchase frequency
- engagement
- sentiment
- price sensitivity
Put simply, churn prediction helps brands stop revenue from quietly leaking out of the funnel.
Measurable Sales Impact
The business case is hard to ignore. Predictive models can improve customer retention rates by 25% to 40% [23]. And a 5% increase in retention can lift profits by 25% to 95% [14].
For subscription-based e-commerce, targeted re-engagement campaigns have been shown to increase Customer Lifetime Value (CLV) by 15% for at-risk groups [10]. That’s a big swing from a small shift in timing and targeting.
Typical Activation Channels
A brand’s response to a churn signal should match both the customer’s predicted value and the likely reason they’re pulling away. High-risk, high-CLV customers often deserve direct outreach from a support or retention team, especially when the signs point to a service problem instead of price sensitivity [22].
For other at-risk customers, automated email and SMS flows triggered by a risk-score threshold often work well [17][8]. Paid remarketing can bring back customers who have already churned. Push and in-app notifications can help re-engage users who are still active but drifting.
And there’s another upside here: the same intent signals used to predict churn can also help spot shoppers who are about to leave without making a purchase.
7. Cart Abandonment Prediction and Recovery
The same behavior signals used to spot churn can also show when a shopper is about to drop out of checkout. Cart abandonment happens at the last possible moment before revenue slips away.
Primary Prediction Target
Assign each shopper an abandonment probability in real time so teams can step in before checkout breaks down.
Core E-commerce Data Inputs
Good scoring depends on checkout-stage signals such as clickstream data, dwell time on specific pages, and real-time cart interactions [21][15]. Session-level details add even more context. Hesitation time, scroll depth, filter usage, shipping page exits, payment retries, and device switching can all point to early signs that a shopper is losing momentum [8][25].
Context matters too. Device type, traffic source, geolocation, and past purchase history help the model tell the difference between a low-intent visitor and someone who was likely going to buy [8][25].
Measurable Sales Impact
The business case is strong. Predictive engagement models can cut cart abandonment rates by up to 25% [24][15]. And when recovery campaigns are highly personalized using predictive insights, conversion gains of up to 60% are possible [21]. The smart move is to save incentives for high-risk shoppers so margin doesn't take a hit.
Typical Activation Channels
| Activation Channel | Predictive Trigger | Typical Action |
|---|---|---|
| On-site pop-up | Predicted exit intent or unusually long hesitation | Personalized discount, free shipping offer [15] |
| Retargeting email | Abandoned session with high purchase intent | Urgency messaging, return-to-cart link [4][15] |
| Push/SMS | Time-sensitive abandonment signal | Real-time reminder [17][21] |
| Chatbot | Friction detected in checkout process | Proactive issue resolution, FAQ support [21] |
Recovered carts also improve the revenue baseline used in the next forecast.
8. Revenue Forecasting for Marketing and Merchandising
Revenue forecasting estimates expected sales dollars, not just demand. It pulls in inventory availability, pricing, and conversion rates [19][26]. Put simply, this is the planning layer that connects inventory, pricing, and marketing.
Primary Prediction Target
The main target is SKU-channel-day granularity. You want to know which products, on which channels, will bring in how much revenue, and at what time. Many AI models return ranges instead of a single number, which gives teams a more honest view of uncertainty [2].
Core E-commerce Data Inputs
Good forecasts usually start with 12 to 24 months of SKU-level sales history so the model can pick up seasonality [1][7]. Ad spend data from Meta, Google, and TikTok shows how budget shifts change revenue. Behavior signals that happen before conversion also matter because they can point to future sales before a purchase takes place [1][2].
Two inputs make or break a realistic revenue plan: stockout history and returns data. Stockout history keeps teams from overstating revenue potential when items weren't available to buy. Returns data matters just as much. In apparel, teams should forecast net demand, not gross sales, because returns can land between 25% and 40% [1][26].
Measurable Sales Impact
The payoff shows up in sharper budget, inventory, and merchandising choices. AI-driven forecasting cuts forecast error by 20% to 50% [1]. It also helps in cases where stockouts and overstock are eating into revenue [19].
A good example comes from ADA Global. The company worked with a global grocer on an AI-driven forecasting system and saw a 15% uplift in forecast accuracy and a 136% ROI through better inventory allocation and revenue growth [4].
Typical Activation Channels
Forecasts only matter when they lead to a clear action. Here's how different forecast windows usually map to planning decisions:
| Forecast Horizon | Granularity | Action |
|---|---|---|
| Weekly | SKU-Day-Channel | Promotions, flash sales, replenishment [1][2] |
| Monthly | SKU-Month | Budget allocation [2] |
| Seasonal (12 months) | Category-Month | Seasonal planning, supplier contracts [1] |
These outputs get more useful when they feed straight into automated planning and decision systems. Developers can build these systems by integrating AI models through unified API gateways to streamline data processing.
How APIMart Fits Into Predictive E-commerce Workflows
Predictive e-commerce workflows often mix a few moving parts: forecasting, text generation, and multimodal output. Once models generate predictions, the next step is turning those results into something teams can actually use day to day. That’s where APIMart comes in.
APIMart gives e-commerce teams access to 500+ AI models through a single API. That makes it easier to connect forecasting models like LightGBM and DeepAR with language models that turn raw outputs into plain-English summaries for operations teams [11][5].
One practical use case is chat-based inventory checks. Instead of digging through forecast tables, a team can ask a natural-language question like, "Which products are at risk of stockout this week?" and get a direct, actionable answer [5]. It’s a lot like asking an analyst for a quick read, except the workflow is built into the system.
The same setup works for retention and recovery too. Predictive models can flag churn risk or cart abandonment scores, while generative models send personalized retention and recovery messages based on those signals [5]. So the prediction doesn’t just sit in a dashboard. It can lead straight to action.
APIMart also supports multimodal workflows for recommendations and campaign content. If a recommender surfaces a product, teams can generate copy, images, and short promotional videos in the same pipeline by using image and language models [2]. That fits neatly into product content workflows for e-commerce merchandising.
This also makes side-by-side workflow comparison easier, especially when teams want to see how different setups perform in actual use.
The comparison table below shows how these workflows differ in practice.
Use Case Comparison at a Glance
These eight use cases don’t do the same job. Each one tackles a different business problem, and in most companies, a different team owns the work.
The simplest way to look at them is this: every use case pulls on a core business lever. That might be conversion, AOV, inventory turns, marketing efficiency, or CLV. The table below shows where each use case fits, what data it needs, who usually owns it, and which KPI it tends to move.
| Use Case | Prediction Target | Main Data Sources | Typical Owner | Primary KPI Impact |
|---|---|---|---|---|
| Demand Forecasting | Future sales volume per SKU/region | Sales history, seasonality, weather, social trends | Operations | Fewer stockouts on top-tier SKUs [2] |
| Inventory Optimization | Optimal reorder points & safety stock | Lead times, inventory levels, sales velocity | Operations | Lower stockouts and carrying costs [3][10] |
| Dynamic Pricing | Price elasticity & optimal price point | Competitor prices, inventory levels, demand signals | Merchandising | Higher net sales and margins [9] |
| Personalized Recommendations | Product affinity & purchase intent | Clickstream, purchase history, session data | Marketing | Conversion and AOV lift |
| Cross-Sell/Upsell | Next likely purchase | Basket analysis, transaction history, user profiles | Marketing | Higher AOV and CLV |
| Churn Prediction | Probability of customer exit | Engagement decay, RFM scores, support tickets | Marketing / Retention | Lower churn and higher CLV [8][14] |
| Cart Abandonment | Recovery probability | Cart contents, scroll velocity, time-on-page, exit-intent signals | Marketing | Recovered orders and conversion lift |
| Revenue Forecasting | Campaign and period-level revenue | Ad spend, historical ROI, macro trends | Marketing / Finance | Better budget allocation and 10–20% efficiency gain [9] |
If you’re deciding where to begin, don’t start with the flashiest model. Start with the decision that hurts the most, happens over and over, has a clear owner, and has enough data behind it to support action.
That last part matters more than people think. A model doesn’t help much if its output never reaches the team that can do something with it. If Operations can act on a forecast, or Marketing can act on a churn score, that’s where the use case starts to pay off.
Conclusion
These eight use cases have one thing in common: they only matter if the output leads to a real decision.
A demand forecast sitting in a dashboard that nobody checks won't cut stockouts. A churn score that never gets to the retention team won't improve retention. Predictive analytics matters when teams can act on it fast enough to change what happens next.
That’s why prioritization is the true starting point. For U.S. e-commerce teams, the best place to begin is usually the highest-cost decision: demand and inventory forecasting. After that, expand only when data quality is in good shape and the team has a working process to act on the output. Once that first workflow is stable, it makes sense to move into nearby use cases.
Scale only after clean data and a real execution workflow are in place. If the process is flawed, scaling just creates bad results faster.
Predictive analytics moves teams from reporting what already happened to acting before losses hit. That shift changes how teams manage inventory, price products, retain customers, and forecast revenue.
FAQs
Where should I start with predictive sales analytics?
Start with the decision that keeps hurting the business most. In many cases, that’s demand forecasting. When forecasts are off, the damage shows up fast through stockouts, excess inventory, and cash tied up in the wrong products.
Before you do anything else, make sure your historical data is clean. A good baseline is 12 to 24 months of sales history. From there, you can use APIMart to study that data alongside real-time signals like website traffic and seasonal trends.
What data do I need for accurate predictions?
Use clean, granular data. Start with 18 to 24 months of SKU-level sales history so you can see trends and seasonality clearly.
Bring in inventory levels, pricing, promo calendars, actual lead times, and past stockouts too. It also helps to flag outliers like influencer drops or ad spikes, since those can skew the picture fast.
Then layer in extra signals that add context, such as:
- Customer reviews
- Social media sentiment
- Website traffic
- Search trends
- Competitor pricing
- Weather data
The goal is simple: give your forecast more context so it reflects what’s happening in the market, not just what happened in your sales log.
How long does it take to see results?
Businesses can start seeing measurable results from predictive sales analytics within the first 90 days. During that stretch, forecast error rates often go down as the models fit into existing workflows and process both historical and real-time data.
And these systems don’t stay fixed. They keep learning, so accuracy usually gets better over time as new data comes in and actual sales results feed back into the model.
Related Blog Posts
Choose the model you want in the model marketplace
Try chat, image and video models in the APIMart model marketplace, and experience model capabilities quickly with one unified API.